Pressure Measurement
Estimating the Frequency Response of Variable Reluctance Pressure Sensors in Gas
Summary –
Frequency response is defined as the ability of a measurement system to accurately reflect dynamic pressure changes. The measurement system consists of a pressure sensor and its associated electronics and plumbing. Each component of the system affects the dynamic frequency response. This blog post will describe the factors affecting the frequency response of variable reluctance transducers, and provide test data that can be used to estimate the frequency response of a variable reluctance transducer used to measure dynamic pressures.
Introduction –
The ability of a pressure sensor to respond accurately to rapid pressure changes is a function of three variables: the mechanical response of the sensor itself, the frequency response of the sensor electronics, and the natural frequency of the plumbing that brings the pressure waveform to the transducer. The mechanical response of the sensor depends on the construction of the sensing element. The electronics connected to a pressure transducer will most likely include damping, or a low-pass filter on the output stage that may even be the most limiting factor in system response. The tubing that leads up to the transducer from the pressure source will also have a resonant frequency that will limit the usable response of the pressure measuring system. Each of these factors must be considered in order to arrive at a good estimate of the accurate response of the pressure measurement system.

Sensor Mechanical Response
Almost all pressure sensing technologies rely on a pressure sensing diaphragm to transmit the dynamic pressure waveform to the electro-mechanical element of the pressure sensor. For sensing technologies other than variable reluctance, the sensing diaphragm is connected via linkages or other mechanical means to a strain gage, piezoelectric, capacitive, or some other electrical sensing element. The stiffness of the sensing diaphragm and the associated linkages create a mechanical spring-mass system whose natural frequency is usually specified by the manufacturer. If the sensor is under-damped, amplification and also dynamic error, of the incoming waveform occurs. If the sensor is over-damped, the incoming pressure waveform is attenuated. In either case, pressure
measurement at or near the natural frequency of the sensor will result in undesirable distortion of the dynamic signal.
Some pressure transmitters used in the process industry have an over-pressure protection scheme whereby the input pressure is transmitted to the sensing element hydraulically. Such a system is highly over-damped and comparatively slow; response times on the order of 0.1 seconds are common. Process transmitters are often further damped electronically because a smooth pressure signal is better for process control applications. These instruments are not suitable for dynamic pressure sensing.
For variable reluctance pressure sensors, the only mechanical part that moves in response to pressure is the sensing diaphragm, and the total displacement over a full scale pressure excursion is less than 2 thousandths of an inch. There are no mechanical linkages or hydraulics inside the sensor to slow down the sensing element. The position of the diaphragm is measured inductively, and this is how the sensed pressure is converted to an electrical signal. The natural frequency of variable reluctance transducer is a function of range, and as shown in the graph. Because the sensing diaphragm is in contact with the gas being measured, the sensor is typically over-damped at its natural frequency.

Electronic Response
The electronics associated with the pressure sensor provide power to the sensing element, amplify the sensing element signal, and include a low-pass filter for transducer output signal. Some sensing technologies, such as strain gage pressure transducers, have a DC excitation. Other sensors, such as variable reluctance and capacitive sensors, require an AC excitation and demodulation to provide a high-level DC output. For AC sensing technologies the excitation carrier frequency will also be a factor limiting dynamic response. Validyne variable reluctance sensors use carrier excitation frequencies of 3 or 5 Khz, so this will be the upper limit of dynamic pressure response. The low-pass output filtering of the variable-reluctance demodultor may also limit dynamic response. Typical cut-off frequencies for Validyne carrier demodulators electronics vary from 1 Khz to less than 100 Hz, depending on the application for which the transducer is intended. The
output filter stages typically roll-off at -12 to -18 dB/octave.
Plumbing Response –
Perhaps the most limiting factor in dynamic pressure response is the second-order resonant system created by the tubing leading up to the transducer combined with the pressure cavity of the sensor. The natural frequency of this system depends on the volume of the sensor cavity, the length and diameter of the tubing and the speed of sound in the gas to be measured. The equation is shown.
 Validyne variable reluctance transducers have very small sensor cavity volumes, 0.004 cu inches for the DP15 and 0.01 cu inches for the DP45. Combined with short lengths of tubing, these transducers offer very high dynamic response, even over low pressure ranges.
As with the sensor natural frequency, it is highly undesirable to attempt dynamic pressure measurements at the natural frequency of the plumbing: severe distortion will occur due to the amplification of the pressure waveform. This frequency at which the distortion is tolerable depends on the damping in the system, and this is a difficult variable to determine. The worst distortion occurs when damping is slight, so assuming this, the maximum usable frequency for any given plumbing system is generally taken to be one fifth or one seventh of its natural frequency. Some typical values:
Lightly Damped System = 0.2 per unit critical damping
At 100% Natural Frequency, Amplification = 2 times input
At 50% Natural Frequency, Amplification = 1.25 times input
At 25% of Natural Frequency, Amplification = 1.05 times input
At 20% of Natural Frequency, Amplification = 1.03 times input
At 15% of Natural Frequency, Amplification = 1.02 times input
DP15, DP45 Plumbing Tests –
In order to test the relationship between the transducer sensor cavity volume, tubing length and resulting natural frequency, the Validyne DP15 and DP45 (14 In H20 FS pressure range) transducers were tested using air and various lengths of 3/16 inch ID plastic tubing. Each transducer was tested as follows:
The transducer and tubing were pressured to approximately 7 In H2O with air. The three way solenoid valve was actuated, creating a step-pressure change on the system. The transducer output was sampled at the rate of 5000 samples per second with a USB2250 data acquisition system. The output was graphed for each transducer and tubing length combination, and the natural frequency determined from the period of the ringing part of the waveform. The observed ringing frequency was compared with the calculated value.

A typical waveform captured is shown below.

Results –
The observed natural frequencies were lower than the calculated natural frequencies, as the tubing lengths were shortened. The lower observed frequencies may be the result of restrictions in the solenoid valve and in the transducer porting and fittings. The actual natural frequencies may be somewhat higher in the absence of the solenoid valve.


Frequency Response Recommendations – Transducers and Carrier Demodulator Selection
For pressures above 2 Inches H2O, the DP15 is the best transducer because of its smaller sensor cavity volume. Below 2 In H2O the DP45 has better sensitivity and only slightly lower natural frequency for any given tubing length. For static line pressures greater than 15 psig, the DP15 must be used. The CD15 or CD16 have the highest low-pass filters, flat to within 5% at 1 Khz, and are the best choice for single-channel applications. For multiple pressure readings, the USB2250 may be used for transient capture to a PC; the AC excitation, demodulation and software is included.
Here are some guidelines to assure the best possible dynamic frequency response:
Plumb the transducers as closely as possible to the source of the pressure waveform. Close coupling is best. This should keep the natural frequency of the plumbing as high as possible: approximately 400 Hz for a DP15 and 330 Hz for the DP45. (in air) Assuming minimal damping, flat response should be 80 to 100 Hz for DP15s in air and 65 to 80 Hz for the DP45.
If the data is to be recorded using a data acquisition system, a sample rate of 5000 samples per second will insure that a digital low-pass filter can be constructed that will eliminate any frequencies present above the system flat response. A multi-tap FIR filter, applied in software after data collection, would insure that the waveforms captured were free from distortion within the flat response range of the transducer and its plumbing.
Example of System Response Estimate
Consider the following system:
DP15-26 transducer is connected by 3 feet of 3/16 in ID tubing to a pneumatic system where 10 In H2O differential pressure fluctuations ranging in frequency to 5 Hz are to be investigated. What is the usable response of such a system if the companion electronics consists of a 3 Khz carrier demodulator having a 250 Hz low-pass third order filter ? What sampling rate should be used by the data acquisition system?
The graph below shows the response of the various system elements. The 3 Khz carrier frequency represents the upper limit of the frequency response in the system, as shown by the line on the extreme right side of the graph. From the graph showing sensor natural frequency as a function of range, 2500 Hz represents the mechanical sensor response for a 0.5 psid transducer. The plumbing natural frequency was observed to be about 100 Hz (see previous graph from test results). The third-order analog filter response is also shown, with its cut-off of 250 Hz. Note that the distortion due to the resonance of the plumbing would be mostly passed by this filter, yielding measurement errors should frequencies above about 25 Hz be present.
The data acquisition system can be constructed so that the flat response of the transducer/plumbing system is optimized. The analog filter will attenuate frequencies above 2500 Hz to a very small amplitude. If the sampling rate is set to 5000 Hz, a minimal distortion will result from any aliasing frequencies present above 2500 Hz. A multi-tap digital FIR filter can be constructed with a cut-off of 25 Hz, so the data can be processed such that the total system response is flat to about 20 Hz. Thus the system is adequate for accurately measuring pressure fluctuations on the order of 5Hz.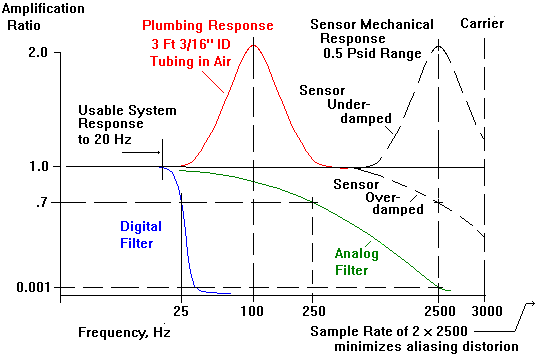
Comments are closed

